E-Learning
Download E-learning PDF


Data Analysis
Package structure
Food Group / Simulant
Migrants
Migrant properties (Concentration, diffusion and partition coefficient)
Migration calculation
Results / Compliance certificate
Package structure
Food group/ Simulant
Migrants
Migrant properties (Concentration, Diffusion and Partition Coefficient)
Migration calculation
Results /Compliance certificate
Package structure
Food group/ Simulant
Migrants
Migrant properties (Concentration, Diffusion and Partition Coefficient)
Migration calculation
Results /Compliance certificate
The SPECIFIC MIGRATION LIMITS Software (SML) allows the specific migration assessment for complex materials with different geometries and any multi-layer structure. Simulation of the migration process is based on Fick’s 2nd law of diffusion under consideration of partitioning between adjacent layers or contact media in closed systems. The software contains a database of more than 20’000 chemicals and offers comprehensive estimation procedures for diffusion and partitioning coefficients. In case of missing required parameters, the software marks the method in red and indicates which parameters are missing. The end-user can add these parameters manually (if known) or has to choose another method.
The use of SPECIFIC MIGRATION LIMITS Software (SML) can proceeds in four steps:
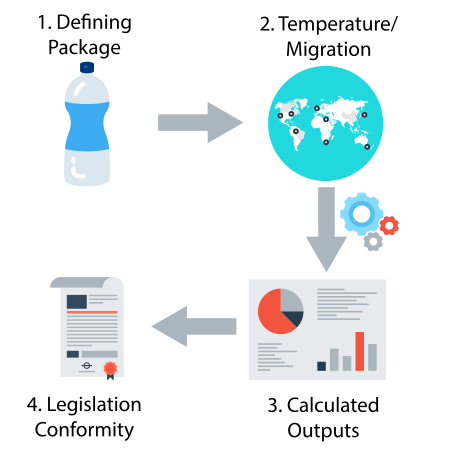
The workflow has therefore 4 main steps:
- 1. Define the package by creating the different articles of the package and introduce their properties.
- 2. Predict the migration using different temperature profiles (iso, non-iso, worldwide climate, etc.).
- 3. Analyse the calculated outputs.
- 4. Check the conformity of the results with corresponding legislations.
Package structure
A package is a group of different articles, each having different layers properties. For instance, a bottle can be treated as two articles: the bottle cap and the bottle body. An article is composed of one or more layers of different sizes and properties.


Food group/ Simulant


Migrants
The migrant properties panel allows defining the properties of the currently selected migrant. When the migrant is set as user-defined, it is possible to enter its properties manually. Otherwise, if the migrant is loaded from the database, its properties are filled automatically.
The database allows browsing for known migrants (more than 20’000 chemicals: additives, monomers, photoinitiators, pigments, solvents, etc.).


Migrant properties (Concentration, Diffusion and Partition Coefficient)
For the prediction of the migration process it is necessary to introduce the key parameters of the migrant:
- The concentration
- The diffusion coefficient
- The partition coefficient


Migration calculation
When all properties of an article are introduced, it is possible to proceed with prediction calculations by clicking on the “Run Prediction” button.
The predictions of the migration can be performed for different temperature profiles:
- Isothermal
- Non-Isothermal
- Stepwise
- Modulated
- Shock
- Worldwide
- STANAG
- Customized


Results/Compliance certificate
The output window shows the results of the simulated predictions. Following results may be displayed:
- The results grid
- The c(t) chart
- The c(x, t) chart
- Comparison Output
- Sum Output
- Compliance Certificate


