E-Learning
Download E-learning PDF


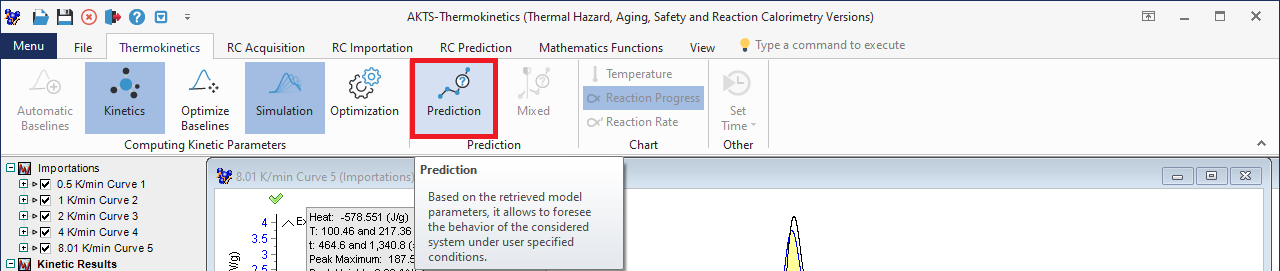
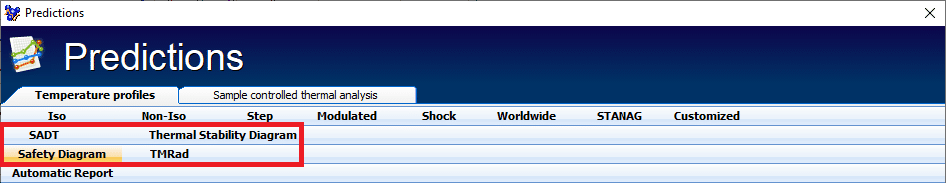
Predictions
GENERAL INFORMATION
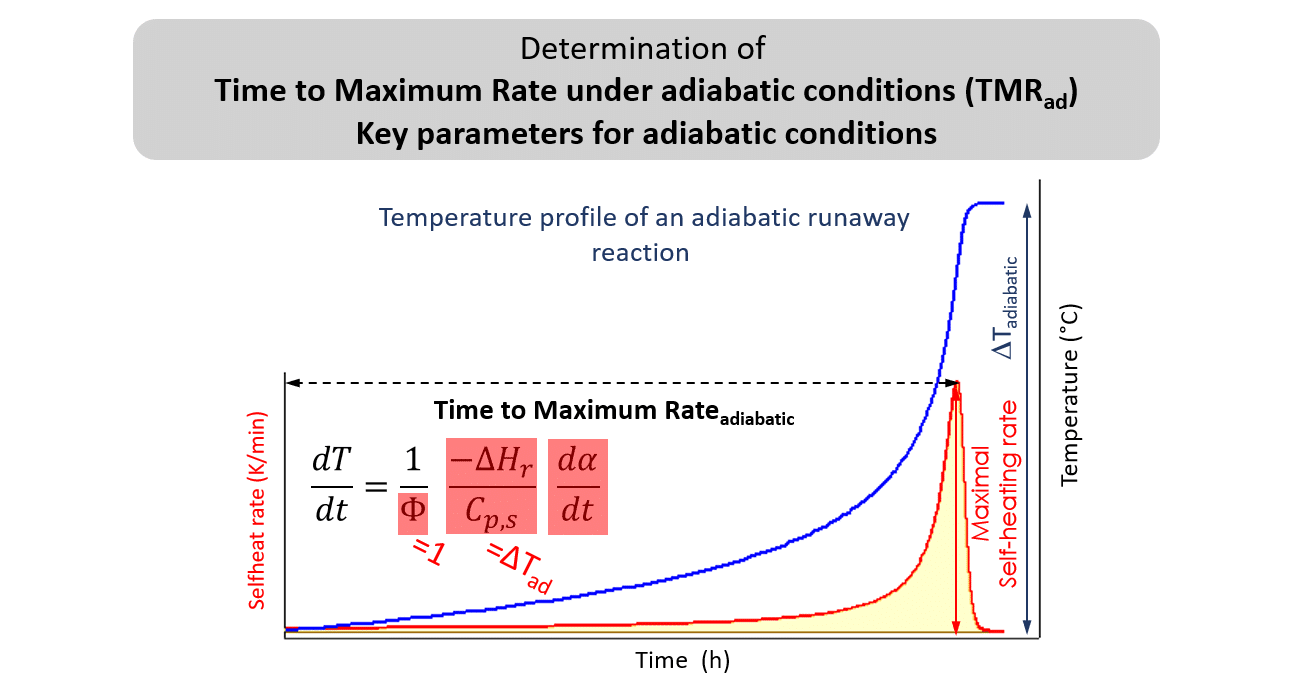
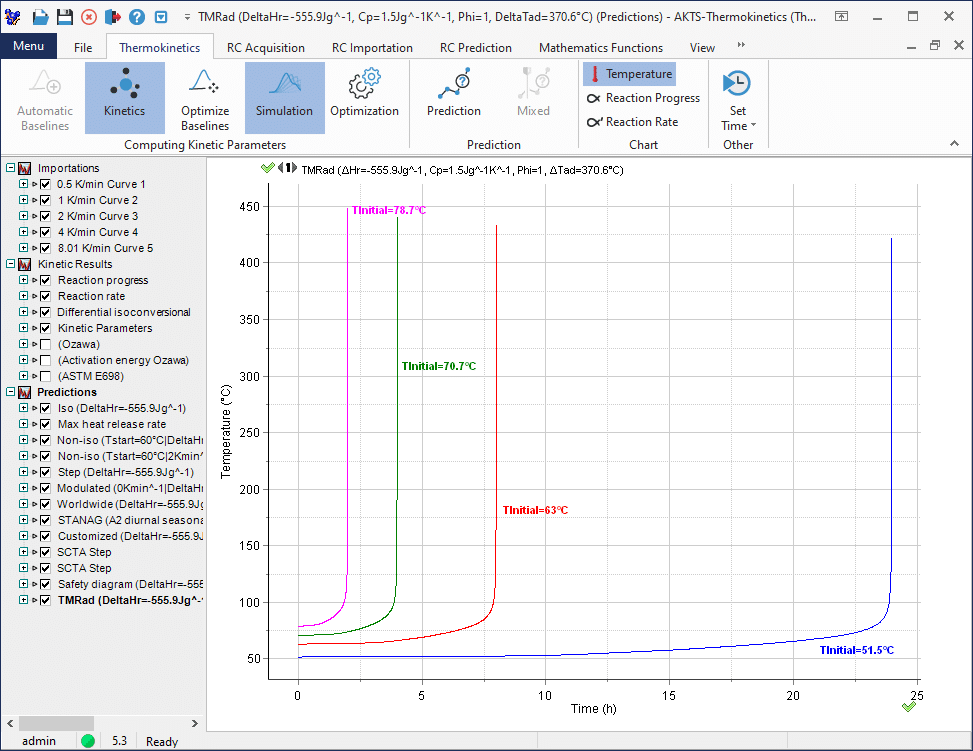
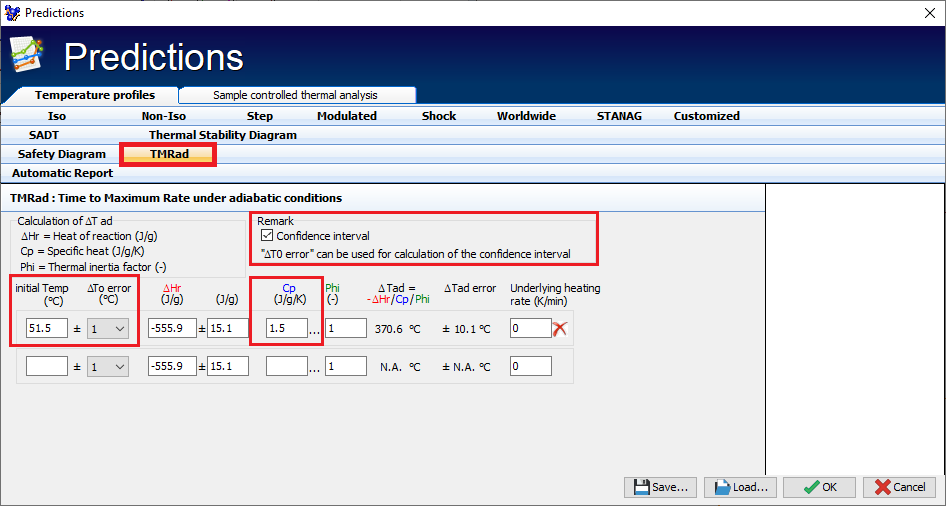
Time-To-Maximum Rate under adiabatic conditions (TMRad) / Adiabatic Thermal Safety Diagram
Adiabatic runaway and self-heating rate curves
Thermal Safety Diagram for non-adiabatic conditions
Simulation of the Self-Accelerating-Decomposition Temperature (SADT) / Simulations of the spatial distribution of temperature and reaction progress during SADT determination
Predictions
GENERAL INFORMATION
Time-To-Maximum Rate under adiabatic conditions (TMRad) / Adiabatic Thermal safety diagram
Adiabatic runaway and self-heating rate curve
Thermal Safety diagram for non-adiabatic conditions
Simulation of the Self-Accelerating-Decomposition Temperature (SADT) / Simulations of the spatial distribution of temperature and reaction progress during SADT determination
Predictions
GENERAL INFORMATION
TIME-TO-MAXIMUM RATE UNDER ADIABATIC CONDITIONS (TMRad) / ADIABATIC THERMAL SAFETY DIAGRAM
Adiabatic runaway and self-heating rate curve
Thermal Safety diagram for non-adiabatic conditions
Simulation of the Self-Accelerating-Decomposition Temperature (SADT) / Simulations of the spatial distribution of temperature and reaction progress during SADT determination
General information
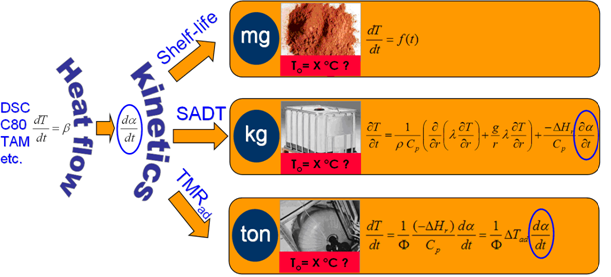
For the prediction of the thermal behaviour in kg-scale, in semi-adiabatic and ton-scale under adiabatic conditions under any temperature mode click the icon “Prediction”.
In all large-scale experiments dT/dt and T(t) are determined by applying appropriate heat balance equations (see figure below). In kg-scale the change of the sample temperature rate dT/dt depends, among others, on the reaction rate da/dt and on the container radius r as well. The temperature of the sample will not be the same in the centre and at the surface of a package and, in addition, it will depend on its size, i.e. r value. In order to determine thermal behaviour in kg-scale, the convective heat transfer from the package (the boundary conditions) and the conductive heat transfer within the package are introduced into the calculating procedure.
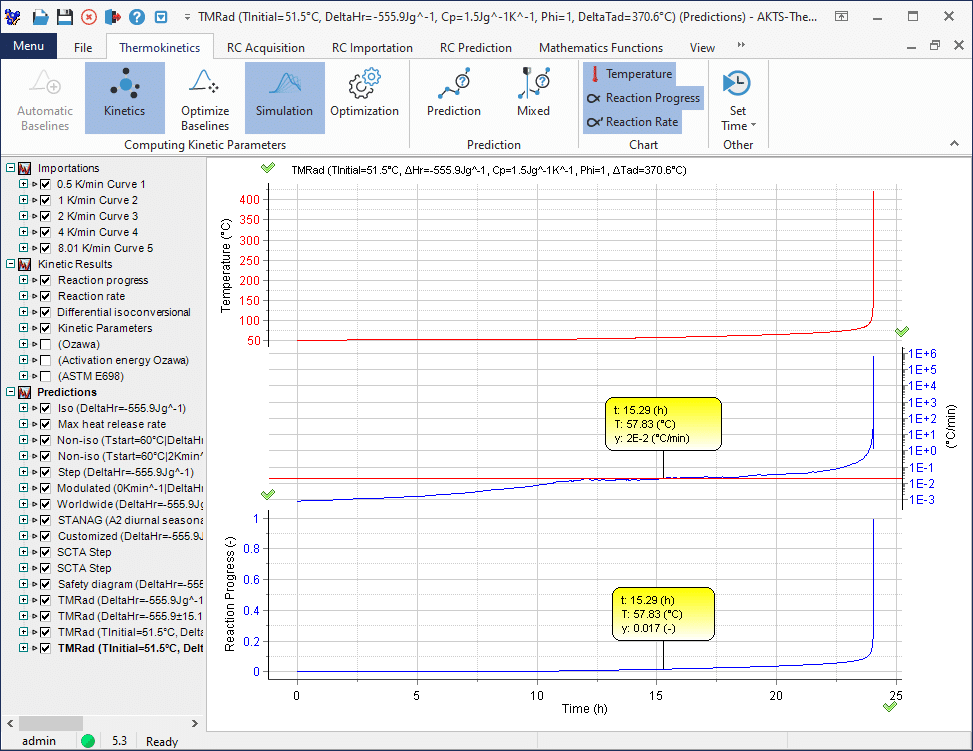
Time-to-maximum rate under adiabatic conditions (TMRad)/ Adiabatic thermal safety diagram
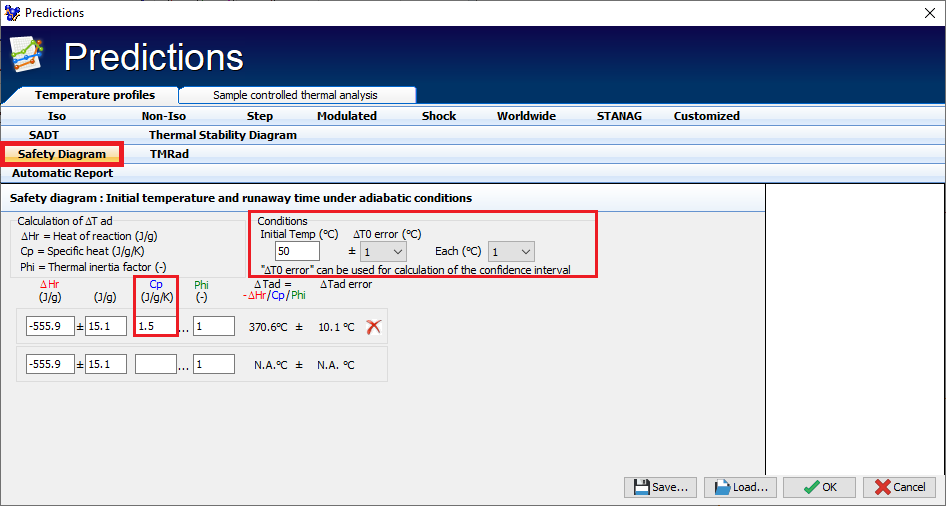
Safety data for following input parameters: ΔHr=-555.9±15.1J/g, Cp=1.5J/g/K, Phi=1 |
|||
|---|---|---|---|
TStart | TMRad (mean value) | TMRad (lower value) | Confidence interval |
89 | 52.27 min | 47.64 min | 8.87 |
88 | 56.55 min | 51.51 min | 8.92 |
87 | 61.21 min | 55.72 min | 8.97 |
86 | 66.28 min | 60.31 min | 9.02 |
85 | 71.82 min | 65.30 min | 9.07 |
84 | 77.85 min | 70.75 min | 9.12 |
83 | 84.43 min | 76.69 min | 9.17 |
82 | 91.61 min | 83.17 min | 9.22 |
81 | 99.45 min | 90.24 min | 9.27 |
80 | 108.03 min | 97.96 min | 9.32 |
79 | 117.4 min | 106.39 min | 9.37 |
78 | 127.65 min | 115.62 min | 9.43 |
77 | 138.87 min | 125.7 min | 9.48 |
76 | 151.15 min | 136.74 min | 9.53 |
75 | 164.61 min | 148.83 min | 9.59 |
74 | 179.37 min | 162.08 min | 9.64 |
73 | 195.55 min | 176.59 min | 9.70 |
72 | 213.31 min | 192.51 min | 9.75 |
71 | 232.82 min | 209.98 min | 9.81 |
70 | 254.25 min | 229.17 min | 9.86 |
69 | 277.8 min | 250.24 min | 9.92 |
68 | 5.06 hours | 273.41 min | 9.98 |
67 | 5.54 hours | 298.89 min | 10.04 |
66 | 6.06 hours | 5.45 hours | 10.10 |
65 | 6.64 hours | 5.96 hours | 10.16 |
64 | 7.27 hours | 6.53 hours | 10.22 |
(*)63 | (*) 7.98 hours | (*) 7.16 hours | 10.28 |
(*)Means that determined TMRad is about 8 hours (7.98 h) for an initial temperature of about 63°C, (a more conservative value is 7.16 h) |
|||
62 | 8.75 hours | 7.85 hours | 10.34 |
61 | 9.61 hours | 8.61 hours | 10.40 |
60 | 10.55 hours | 9.45 hours | 10.46 |
59 | 11.6 hours | 10.38 hours | 10.52 |
58 | 12.75 hours | 11.4 hours | 10.59 |
57 | 14.04 hours | 12.54 hours | 10.65 |
56 | 15.46 hours | 13.8 hours | 10.71 |
55 | 17.03 hours | 15.2 hours | 10.78 |
54 | 18.78 hours | 16.74 hours | 10.84 |
53 | 20.72 hours | 18.46 hours | 10.91 |
(**)52 | (**)22.87 hours | (**)20.36 hours | 10.97 |
(**) Means that determined TMRad is about 24 hours (22.87 h) for an initial temperature of about 52°C, (for that temperature a more conservative value is 20.36 h) |
|||
51 | 25.27 hours | 22.48 hours | 11.04 |
50 | 27.94 hours | 24.83 hours | 11.11 |
Table 1. Thermal safety table: Dependence of TMRad on initial temperatures under adiabatic conditions.
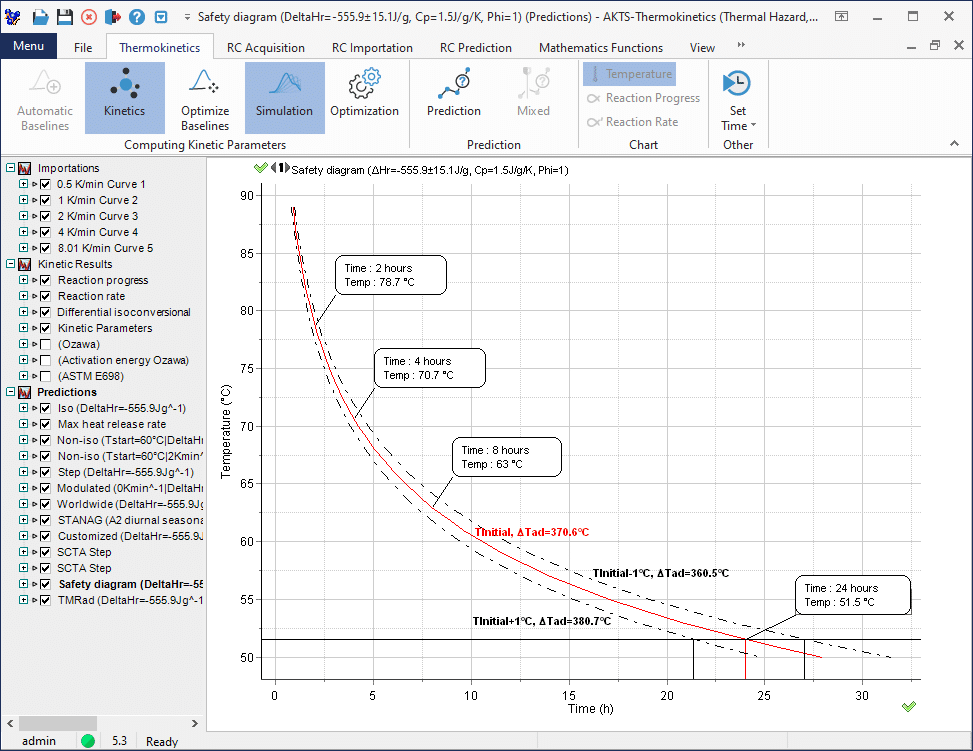
Adiabatic runaway and self-heating rate curves
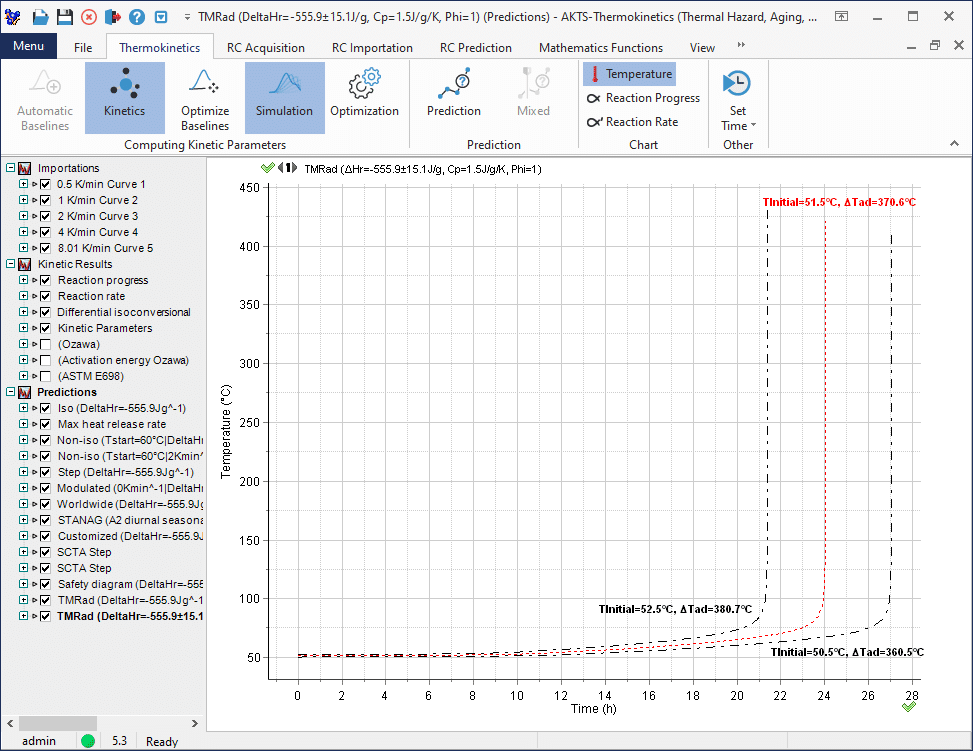
The TS software also allows the calculation of self-heating rate curves in adiabatic conditions (see below):
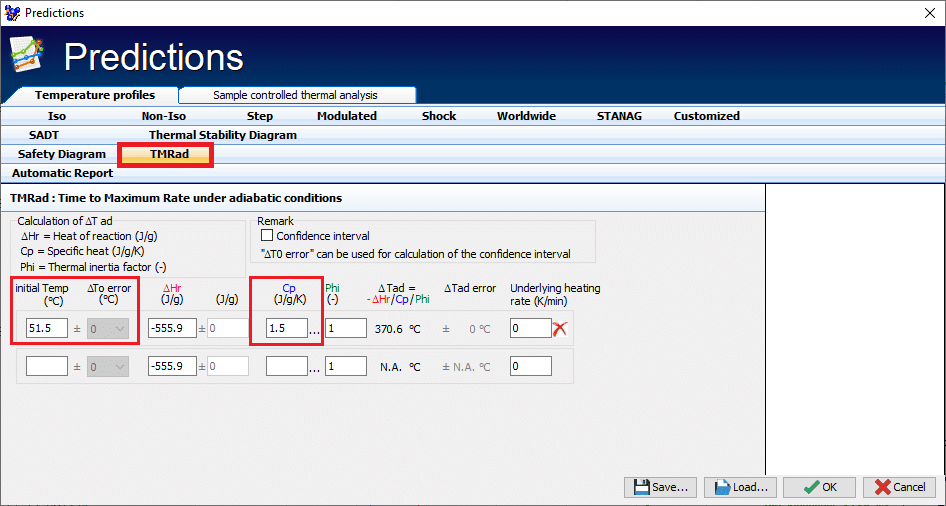
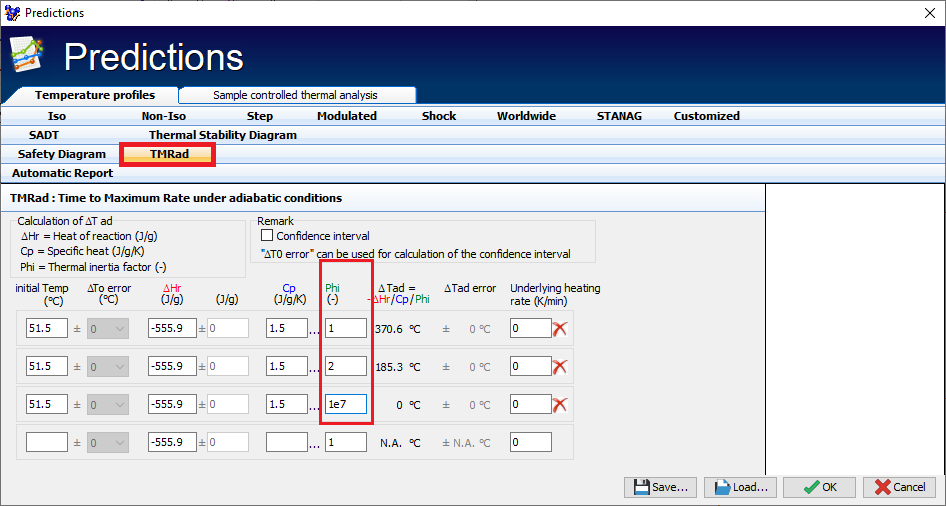
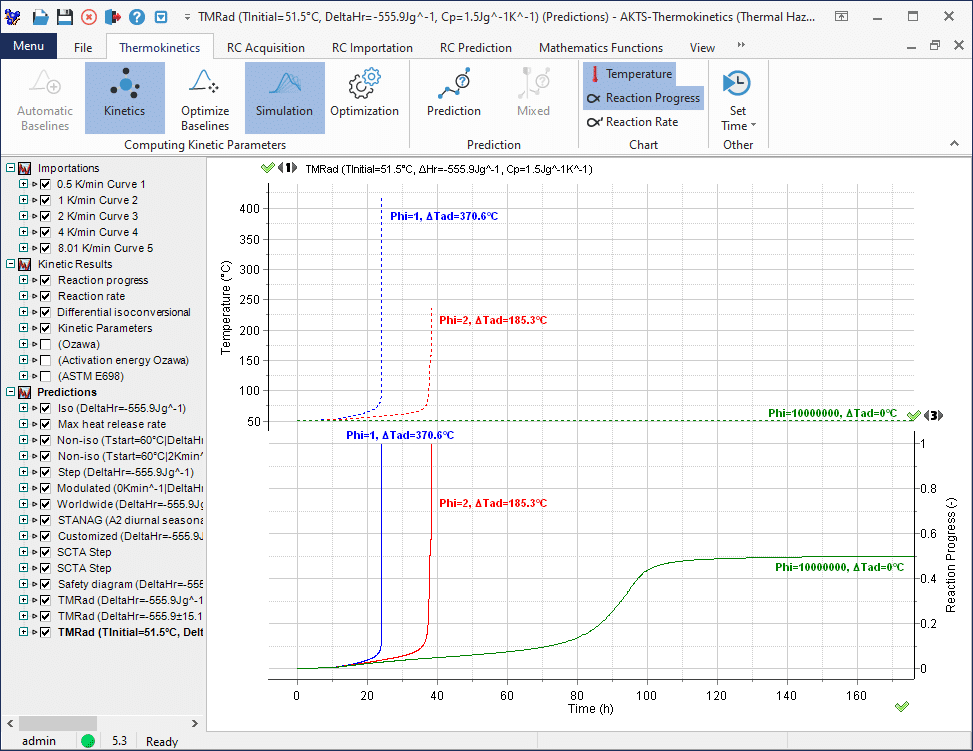
The blue curve in the graph above presents the simulation of the reaction course in ton-scale (fully adiabatic conditions, Phi=1), the green curve in mg scale (total exchange of the reaction heat with surrounding, Phi taken as 1e+7). The red curve displays the reaction behaviour in semi-adiabatic conditions for Phi=2. For checking the influence of the thermal inertia (Phi factor) on TMRad introduce required values of phi-factor in respective fields as shown below:
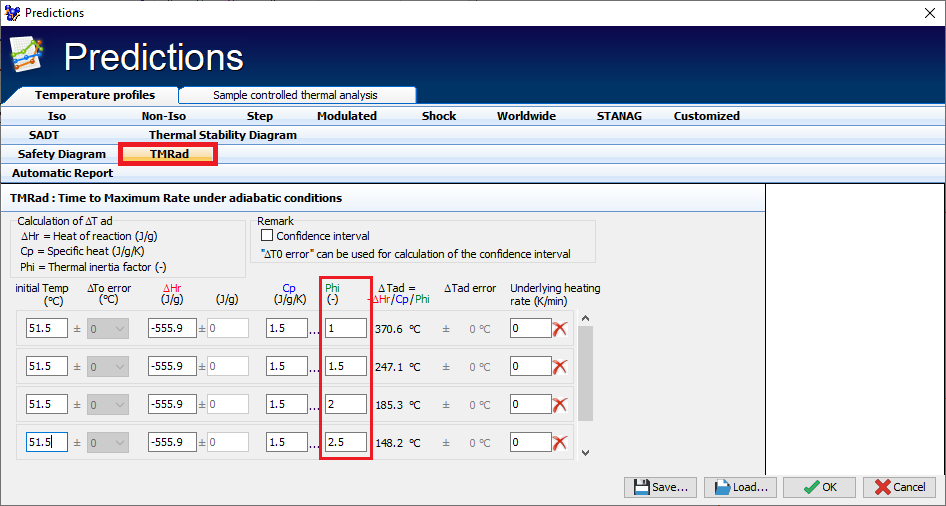
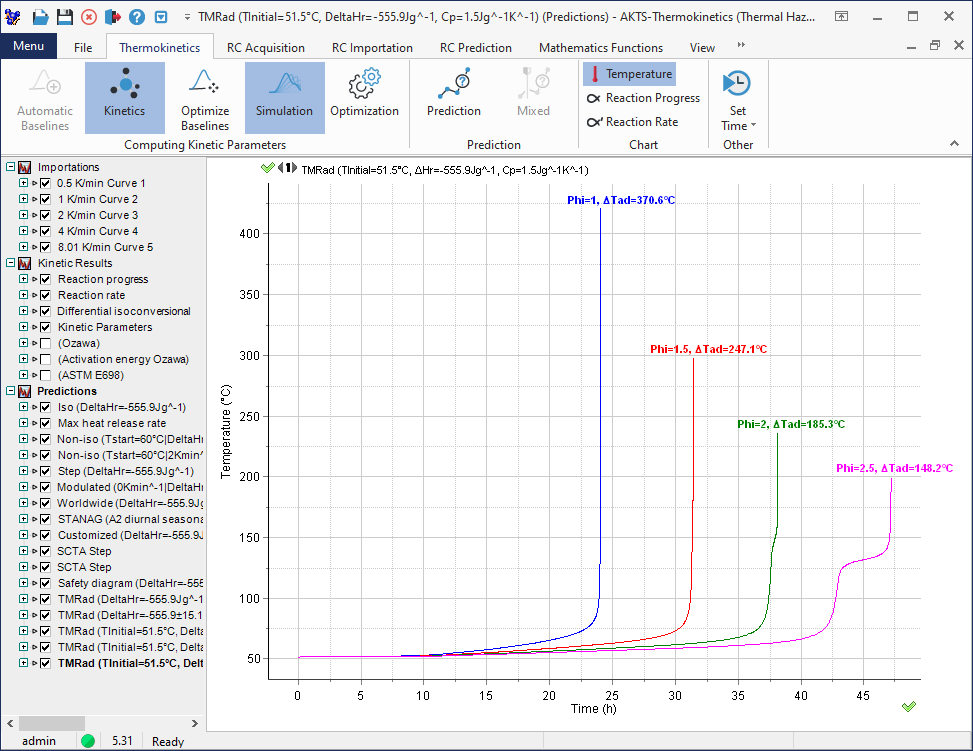
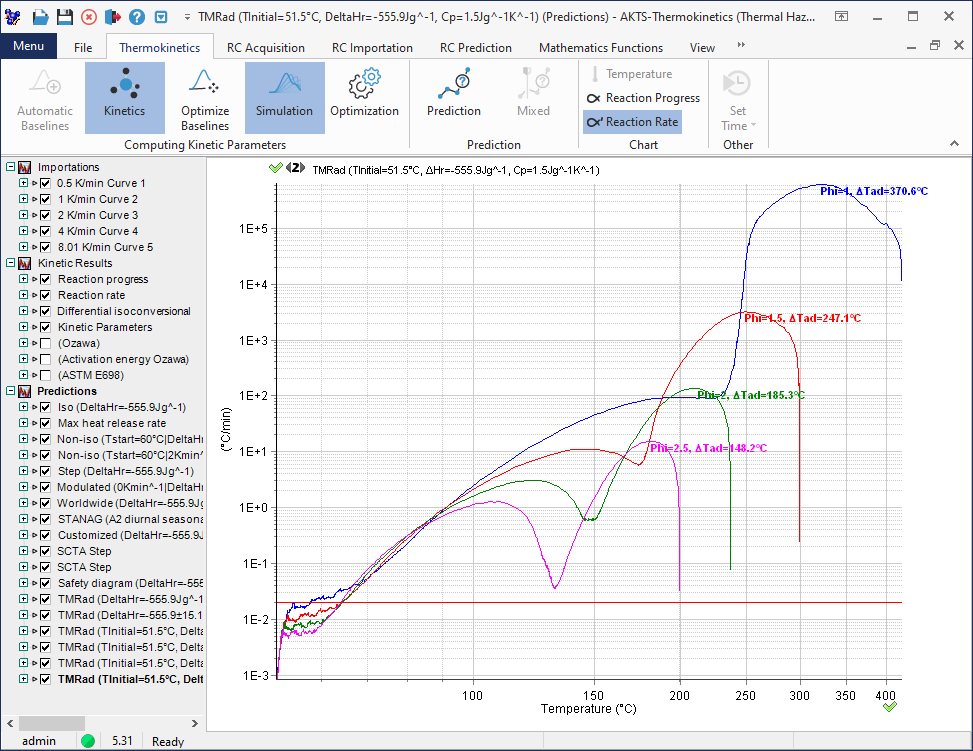
Φ | ΔTad /K |
|---|---|
1 | 370.6 |
1.5 | 247.1 |
2 | 185.3 |
2.5 | 148.2 |
Table 1 – Influence of the Phi factor on the ΔTad at following conditions: Tinitial =51.5°C, ΔHr = -555.9±15.1 J/g and Cp = 1.5 J/g/K
Thermal Safety Diagram for non-adiabatic conditions
Click on the tab Thermal Stability Diagram’ to calculate the Time to the Maximum Rate under non-adiabatic conditions as a function of the external conditions and the sample properties.
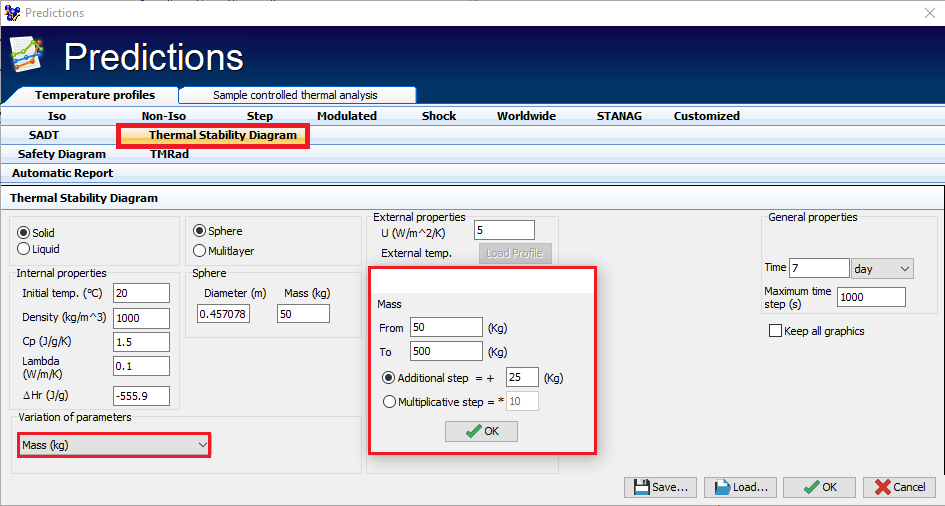
The Thermal Stability Diagram allows evaluating the dependence of the Time to Maximum Rate under any, non-adiabatic conditions, as a function of the external- (temperature, size and geometry of the container) and internal parameters, specific to the sample (such as density, specific heat, thermal conductivity, etc.).
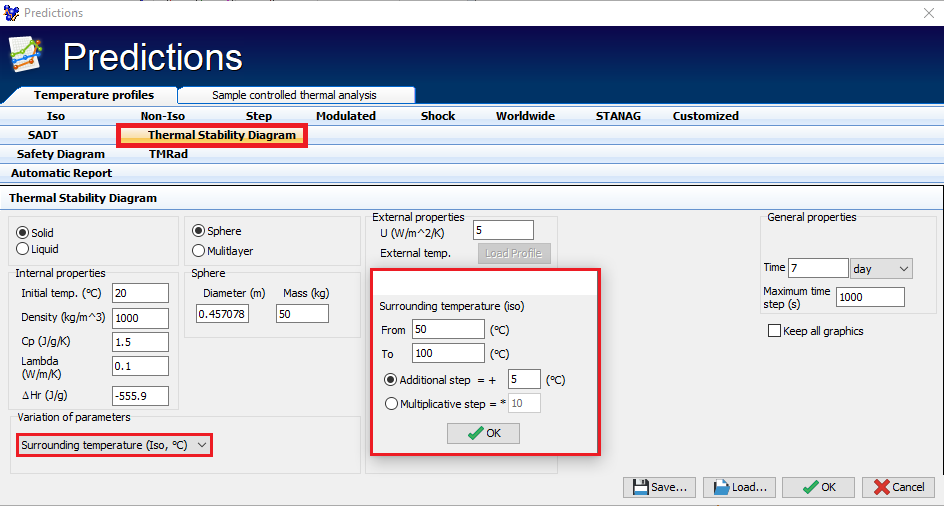
Fig.1 – Input of the surrounding temperature during the evaluation of the dependence of the time to maximum rate under non-adiabatic conditions.
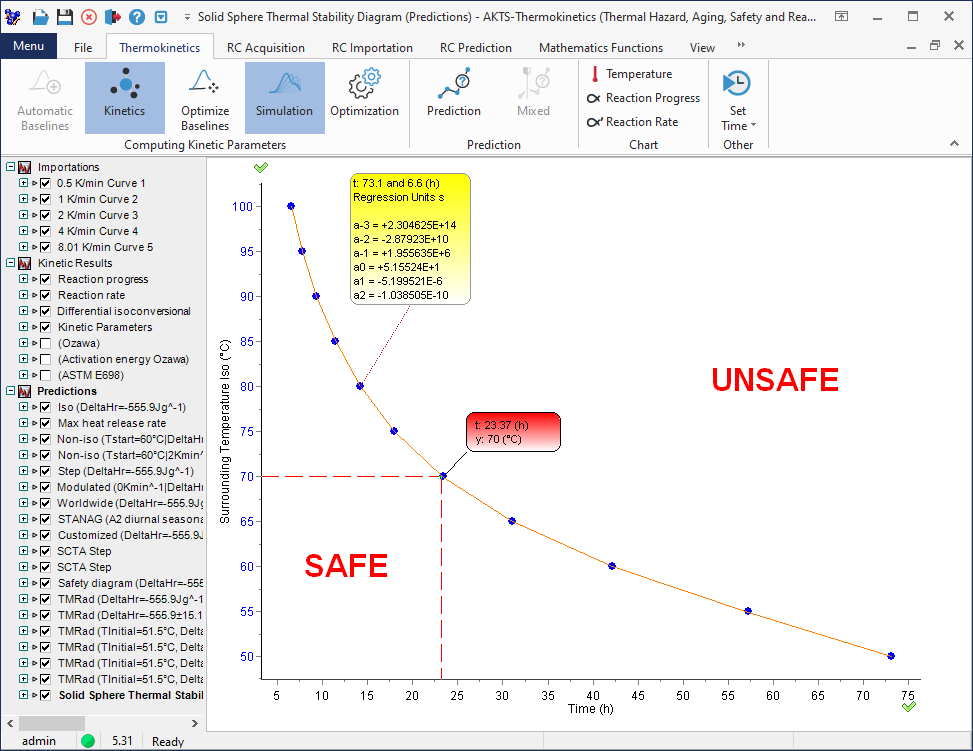
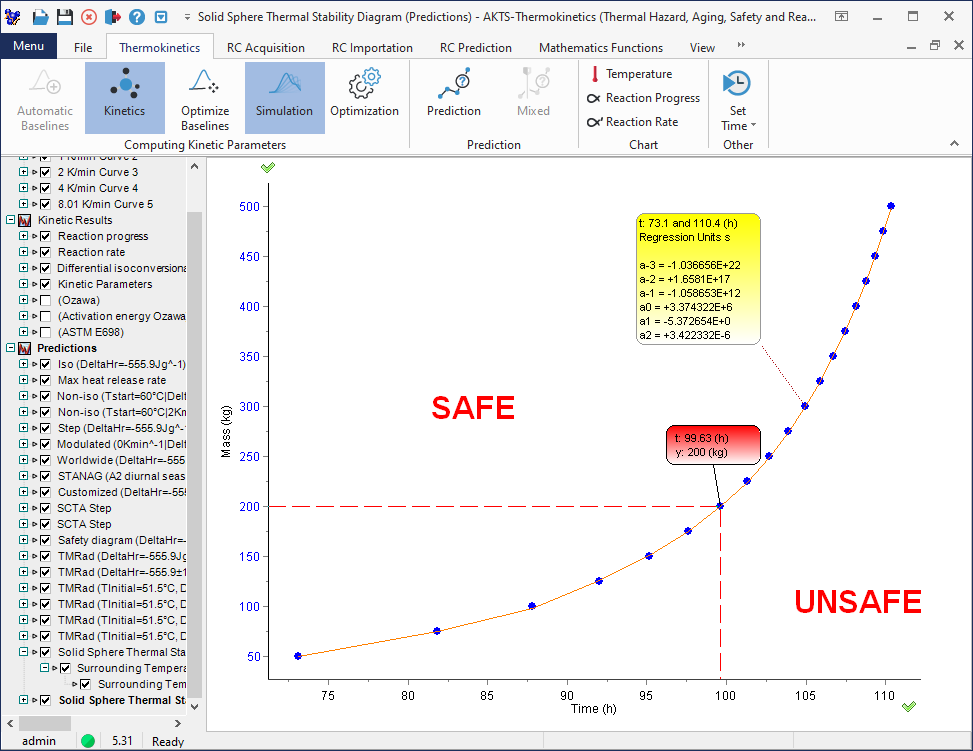
The diagram shown below displays two zones: safe and unsafe and transparently presents the time in which the operations with the material are safe. The plot depicted below shows the impact of the surrounding temperature on the time of reaching the maximal rate of the reaction for parameters introduced by user.
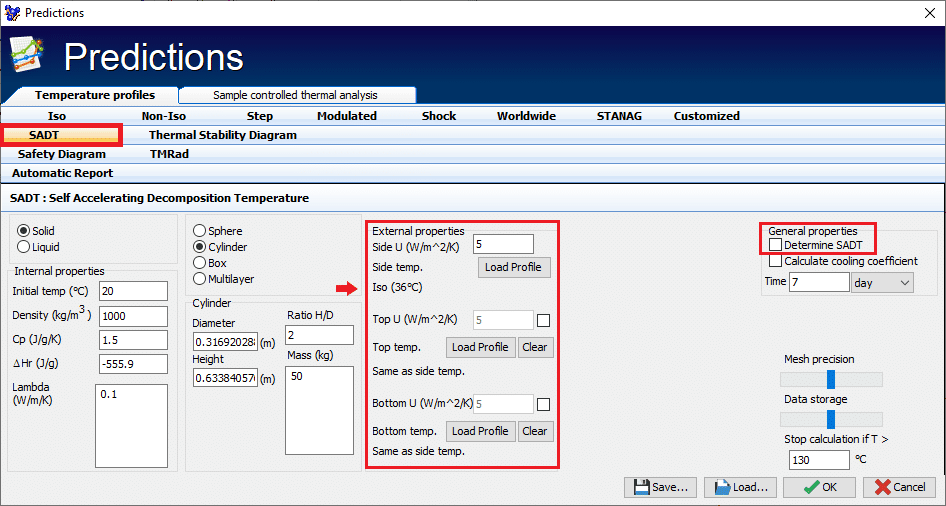
Simulation of the Self-Accelerating-Decomposition Temperature (SADT)
The prediction of the thermal behaviour in kg-scale is illustrated by the determination of the Self-Accelerating Decomposition Temperature (SADT) according to the recommendations of Manual of Tests and Criteria of the United Nations on the transport of dangerous goods (the so-called ‘Orange Books’). One can find few different definitions of SADT, however in our Software we apply the definition given in the ‘Orange Books’.
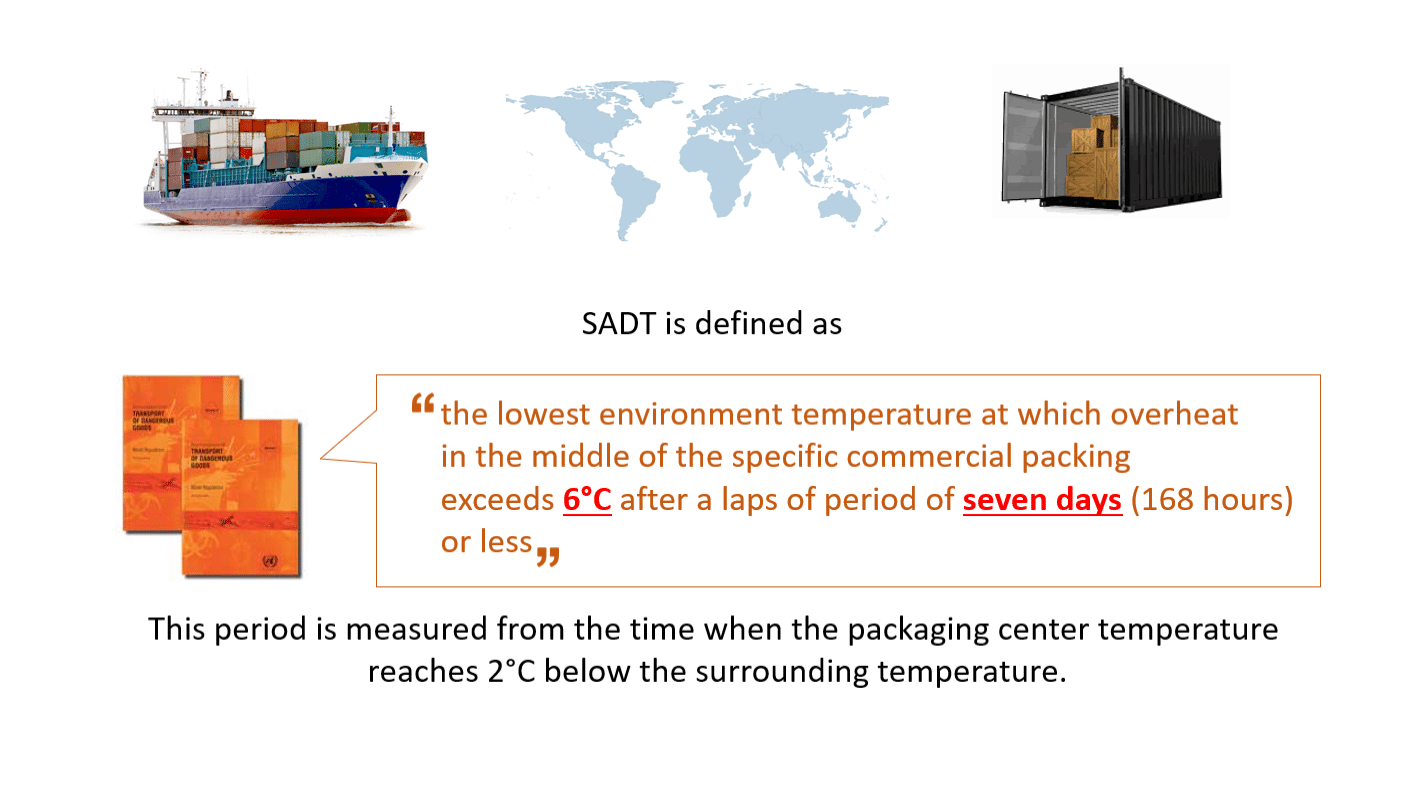
Fig. 1 -Definition of the Self-Accelerating-Decomposition Temperature (SADT) given in the Orange Book.
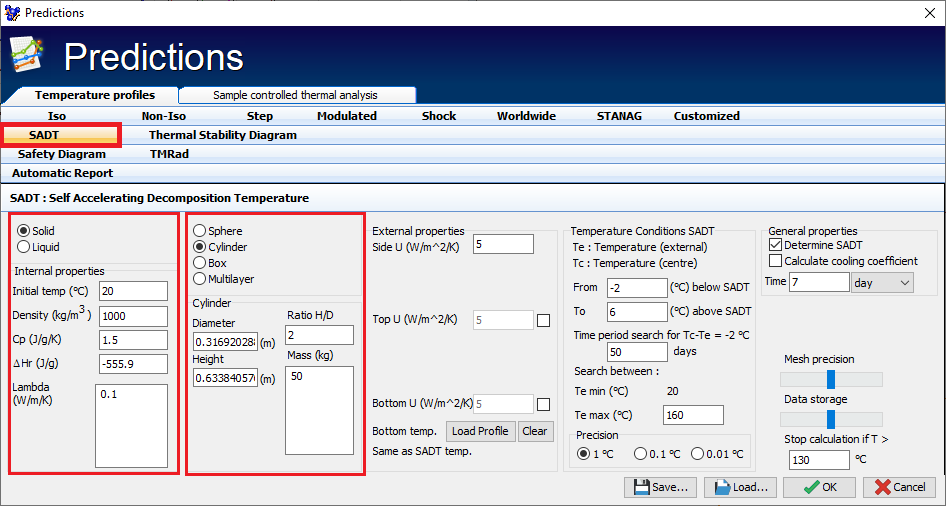
Click on the tab SADT to proceed with calculations.
SADT calculation requires specifying:
- The physico-chemical properties of the examined material such as its density, specific heat capacity, heat of reaction and thermal conductivity (solids) and
- Container’s geometry and size
- Sample mass
Thermal Safety Software allows to determine the effect of properties of containers on the reaction progress and heat accumulation conditions. The user can evaluate the critical container parameters such as its critical radius, the necessary thickness of insulation, and the influence of the surrounding temperature on storage and transport safety.
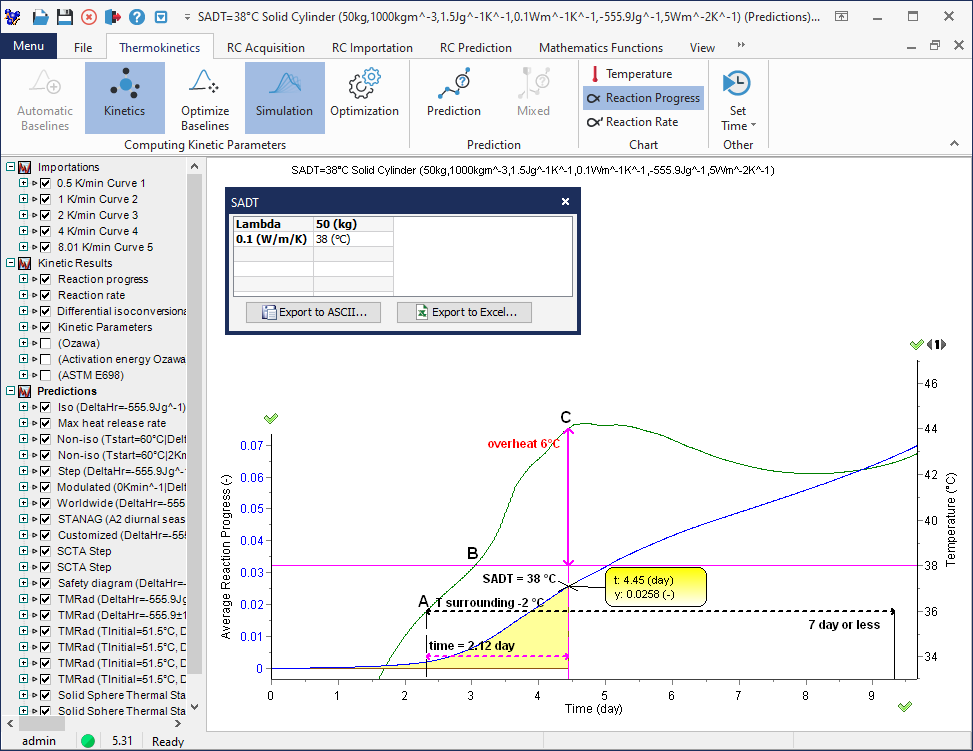
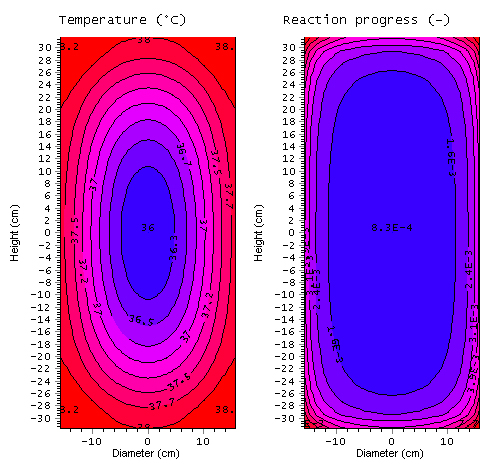
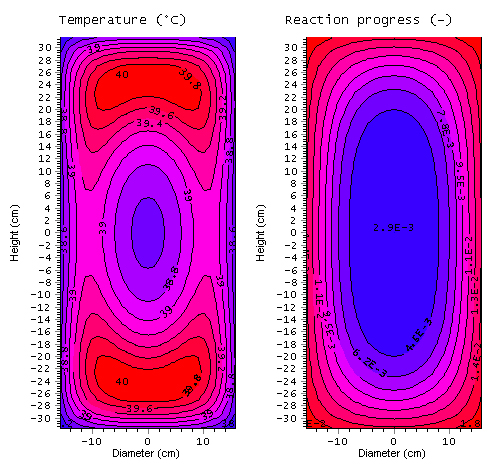
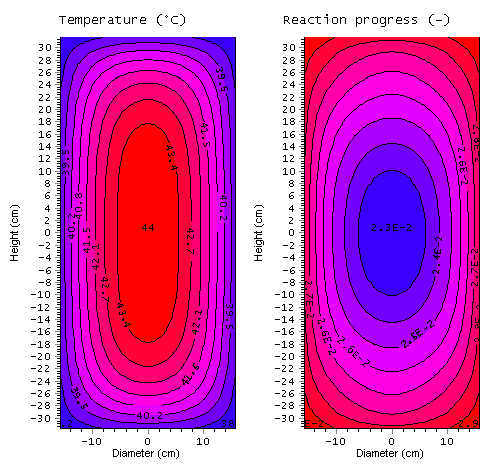
Simulations of the spatial distribution of temperature and reaction progress
Software allows the SADT determination and the simulation of the thermal behaviour of the material in the container at any temperature (e.g. at points A, B and C in the plot above).
Uncheck ‘Determine SADT’ and introduce in “External properties” any requested temperature profiles.