Short description
Benefits at a glance
Evaluation of kinetic parameters from sparse data (e.g. GC or HPLC data collected at three temperatures only)
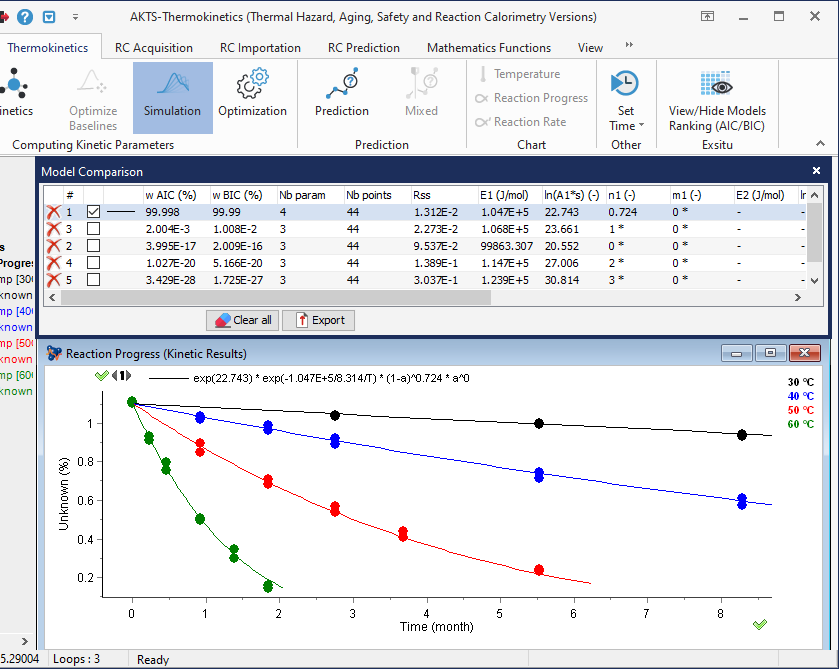
Application of advanced statistics (Akaike and Bayesian information criteria) for kinetic model selection and ranking.
S-shape kinetic models applied for single- or multiple reaction stages
Possibility of simulation of the reaction progress after arbitrarily chosen aging time under any temperature profile
Bootstrap method for evaluation of prediction bands particularly important for a long-term predictions based only on 20-30 experimental points
Non-linear optimization method applicable to complex multi-stage models
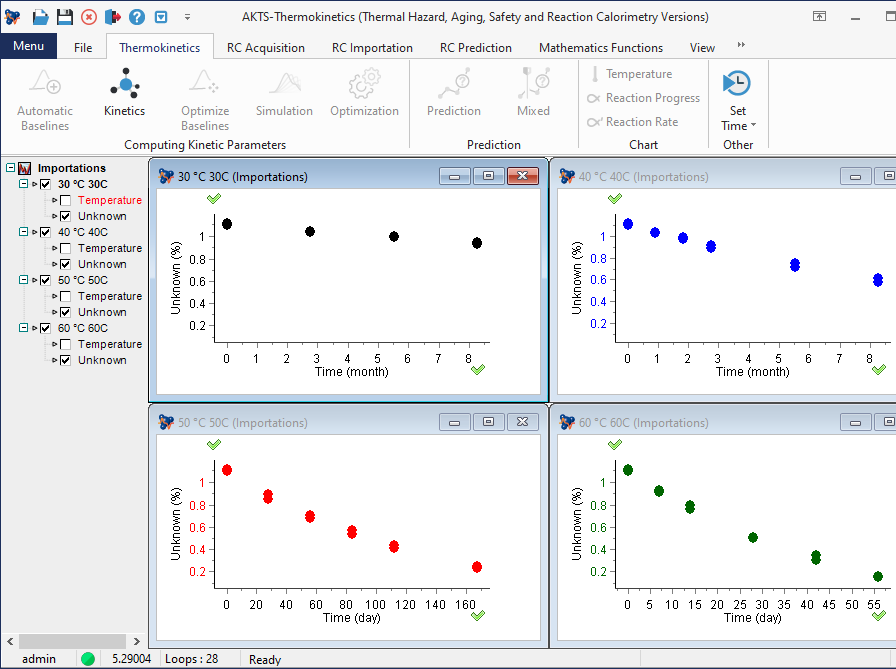
TKsd software permits the application of sparse data collected only at a few temperatures and time-points in kinetic analysis
THERMOKINETICS Sparse Data Software (TKsd) is applied for the kinetic analysis of discontinuously collected results (e.g. HPLC) when the number of experimental points is 30 or less. For elaboration of such sparse data it is necessary to modify the kinetic analysis and apply the specific statistical approach.
Model selection based on advanced kinetic and statistical methods
For the elaboration of sparse data, the modified S-shape kinetic models are applied without limitation of the number of the reaction stages. Model selection procedure is based on Akaike and Bayesian information criteria. They allow us to determine which model is more likely to fit better the considered data and quantify how much more likely.
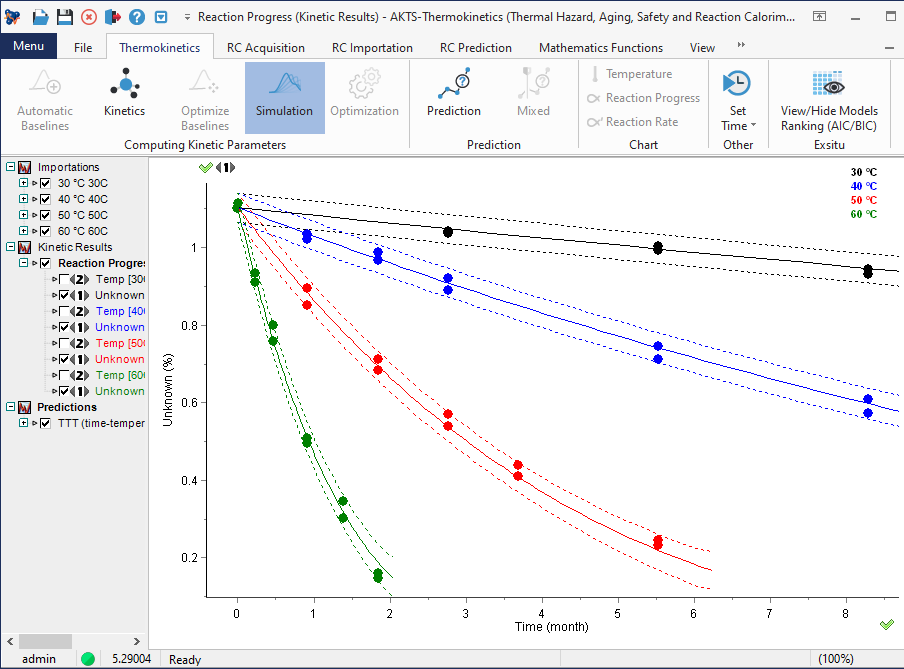
Prediction bands provided by the Bootstrap method
Prediction of the thermal behavior based on sparse experimental points may be verified by the data collected in long-term measurements. Prediction of the change of material properties (solid lines) was based on kinetic analysis 44 of experimental points collected during 252 days in a range of 30-60°C. The prediction bands marked by the Bootstrap method are displayed as dashed lines.
Prediction of Time-Temperature-Transformation (TTT) -Diagram
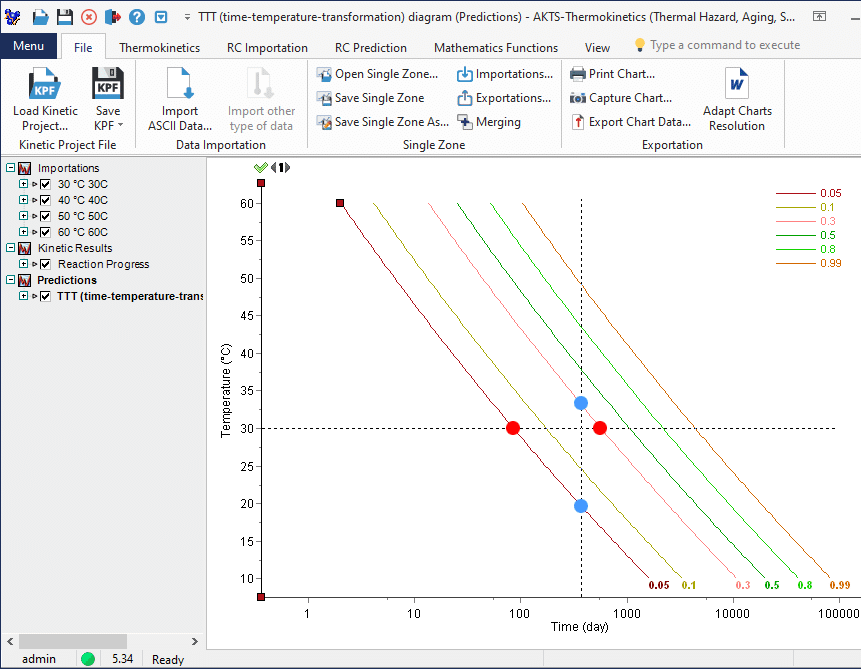
After determining of the best kinetic models it is possible to create the TTT diagram, which presents the mutual dependence of the time, temperature and progress of transformation (meant as a reaction extent).
At 30°C the reaction extents of 5% (0.05) and 30% (0.3) are reached after 86 and 573.5 days (red circles), respectively. After one year, the reaction extents 0.05 and 0.3 were reached (blue circles) at 19.8 and 33.3°C, respectively.
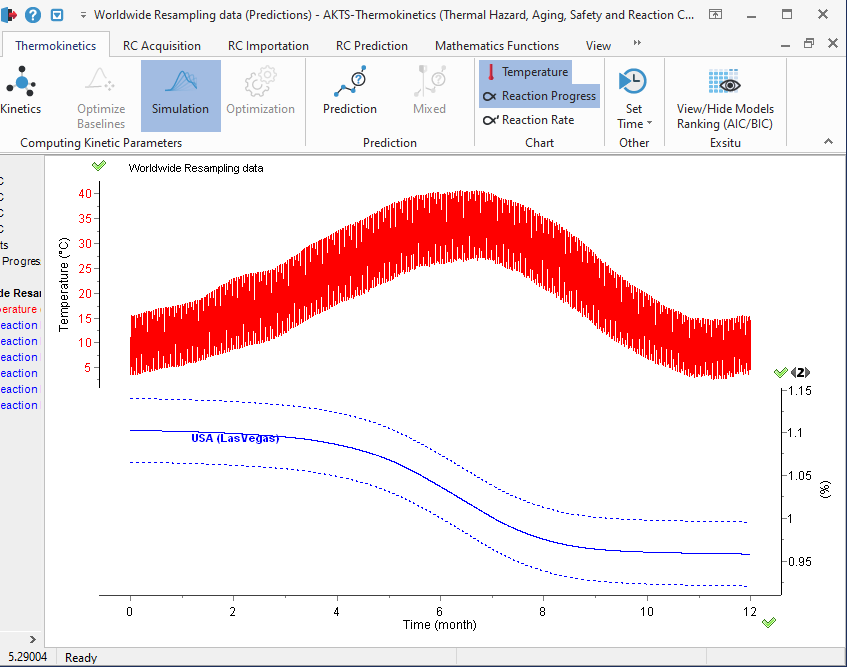
Simulation of thermal behavior with prediction band at different climate zones (e.g. Las Vegas)
Graph displays the prediction of the decomposition extent (with prediction bands) in the climate zone of Las Vegas (USA). Yearly temperature fluctuations are displayed in red in the top section of the graph.
If you want more information about this Software, click here

