Short description
Benefits at a glance
Automatic baseline construction and use of the differential isoconversional method of Friedman (model free) for an advanced baseline optimization
Different types of baseline considered: Sigmoid, Tangential Sigmoid, Linear Horizontal First- or Last Point, Tangential and many more
Smoothing of data (Savitzky-Golay or Gaussian) and spikes correction
Differential isoconversional method of Friedman (model free)
Integral isoconversional method of Ozawa-Flynn-Wall (model free)
Standard procedure of ASTM A698
Prediction of the reaction progress and thermal stability
of materials under
any temperature mode
Variety of options for
customizing the chart
and its exporting in the required format
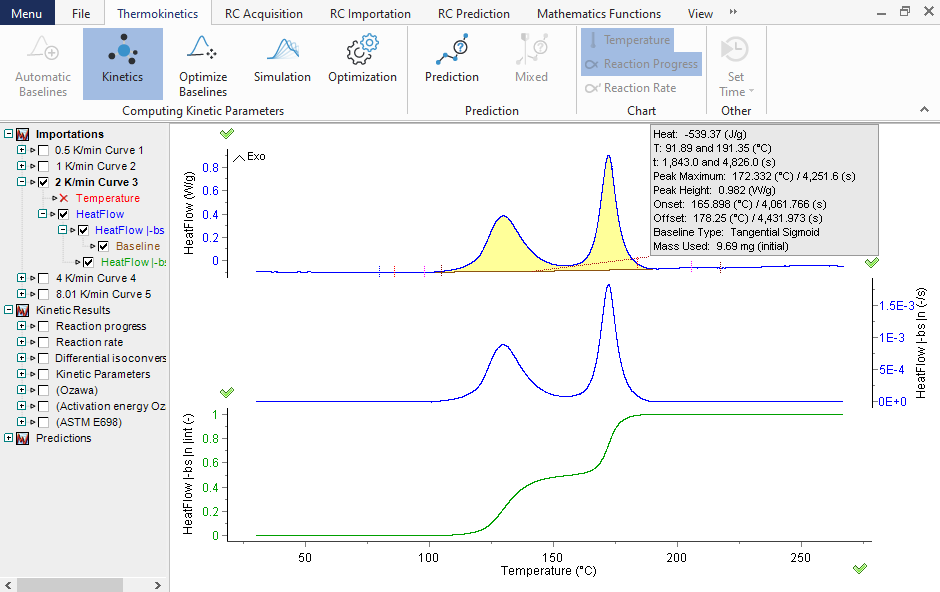
Determination of the reaction rate dα/dt and reaction extent α evaluated from heat-flow signals
The kinetic parameters are evaluated from the conventional thermoanalytical measurements carried out in any, mainly iso- and non-isothermal, temperature mode. The graph depicts the determination of the reaction extent α (bottom section) evaluated from the heat flow signals presented in the top section.
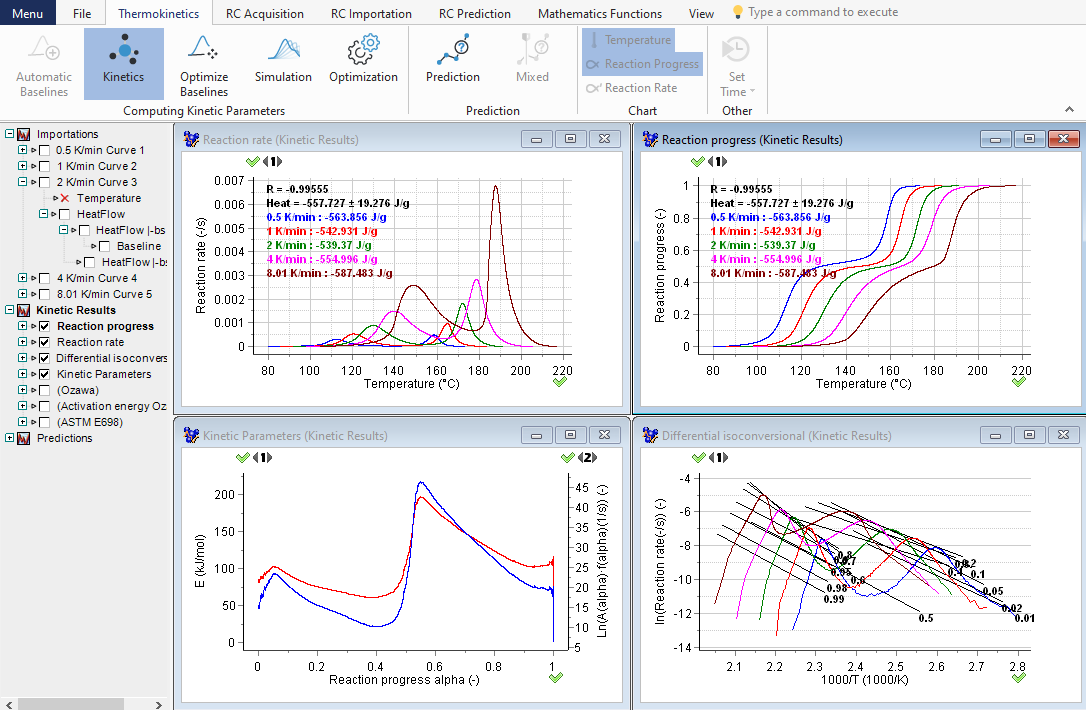
Differential isoconversional analysis based on heat-flow signals
In advanced kinetic analysis, two main kinetic approaches are applied: isoconversional (differential and integral) and model fitting. The graph displays the results of the isoconversional differential analysis based on the heat flow signals recorded in few heating rates. The top section displays the dependence of the heat flow curves and reaction extent on the temperature; the bottom section presents the dependence of the kinetic parameters (E and A) on the reaction extent α.
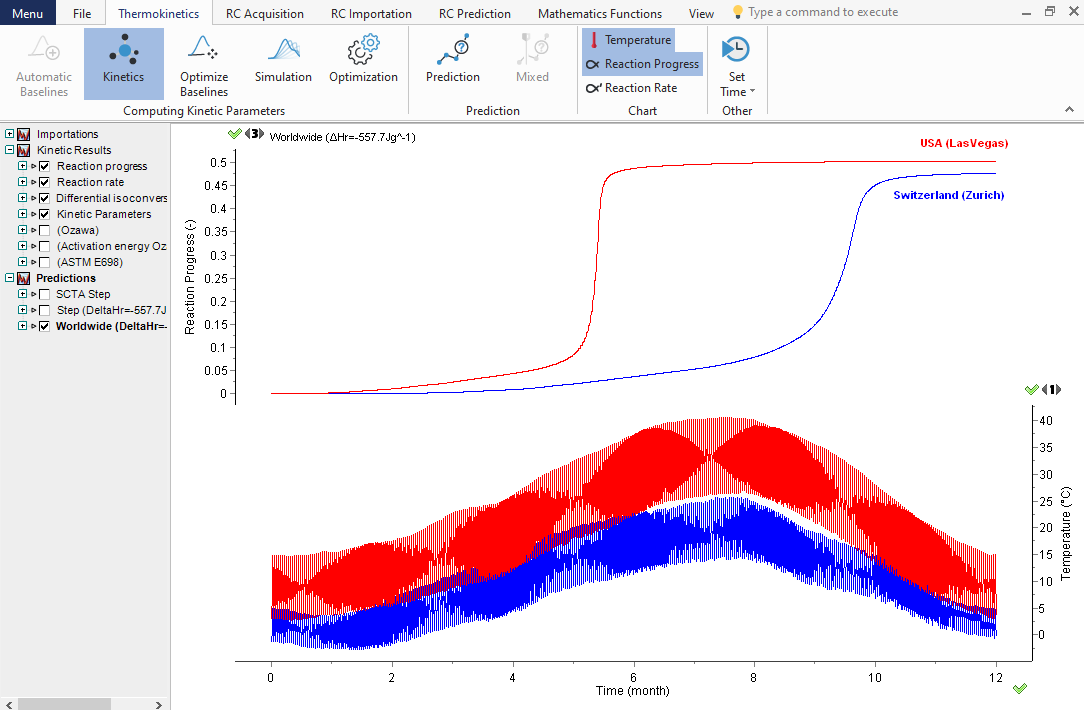
Prediction of the influence of the atmospheric temperature profiles on the reaction course
Top: Reaction progresses (normalized signals) as a function of time for Zurich and Las Vegas temperature profiles. Bottom: Average daily minimal and maximal temperatures recorded over 30 years in Zurich (blue) and Las Vegas, USA, (red).
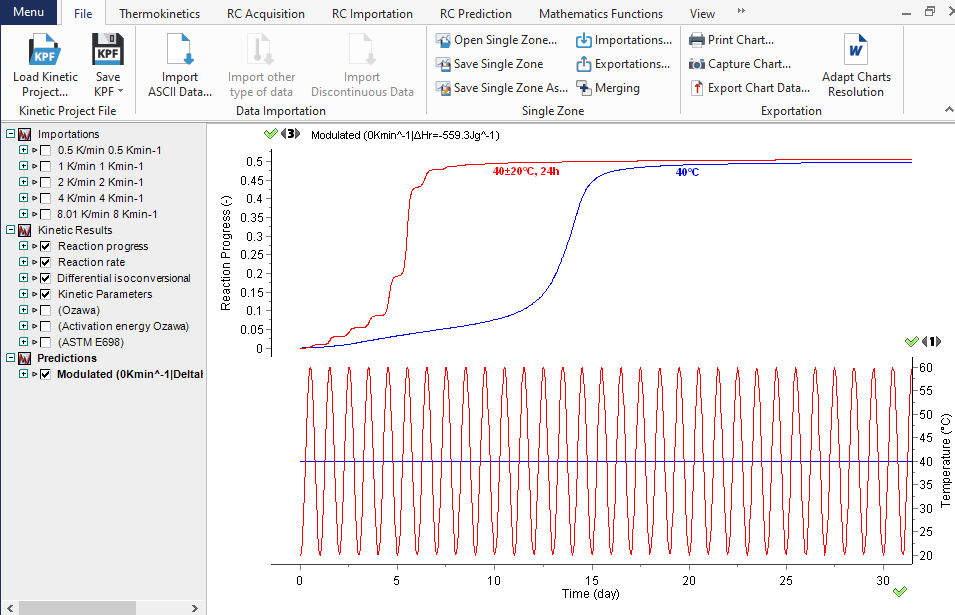
Prediction of the reaction course at customized temperatures
The knowledge of the kinetic parameters allows predicting the thermal behavior of the materials, such as their shelf life, the aging rate, the course of the decomposition under arbitrarily chosen temperature mode. The graph displays the decomposition progress (top section) at a constant temperature of 40°C (blue curve) and during temperature modulations (red curve) 40 ±20°C, which are shown in the bottom section.
Prediction of the reaction course for any set of temperature-time data as e.g. step-wise mode
The reaction rate (heat flow in blue) and reaction progress α (heat release in green) as a function of time at subsequent isothermal and non-isothermal temperature zones (red).
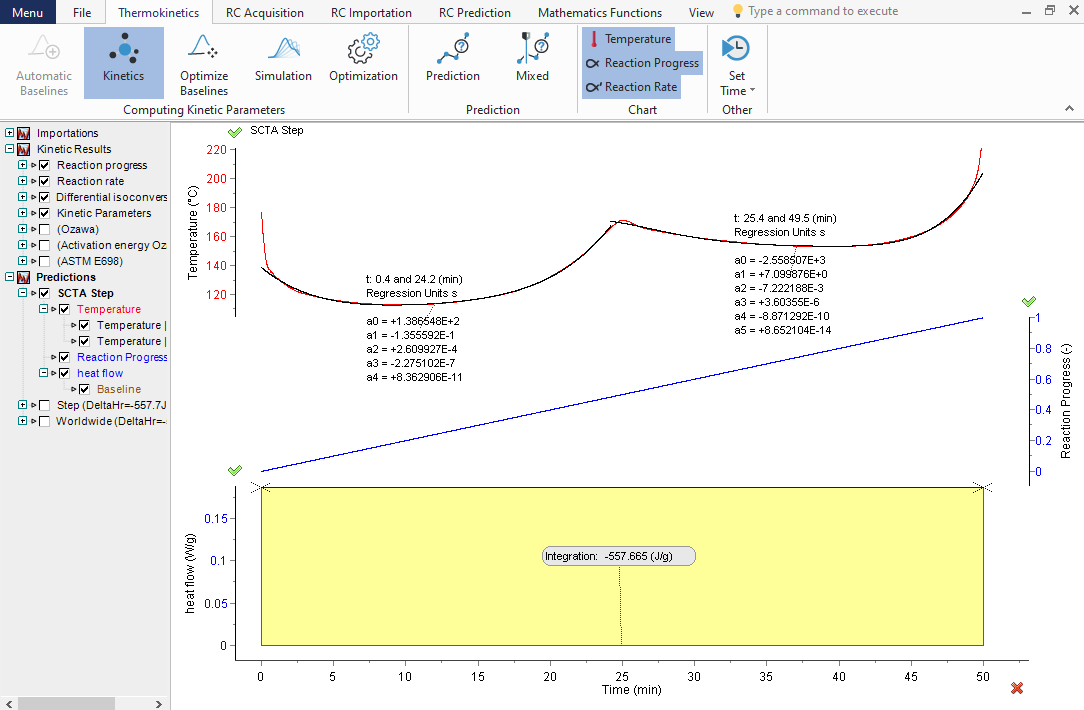
Prediction of rate-controlled reaction course in Sample Controlled Thermal Analysis mode
TK Software allows predicting the reaction course for the temperature mode required to obtain the chosen, set by the user, constant reaction rate. This specific technique is known as Sample Controlled Thermal Analysis or Controlled Rate Thermal analysis (CRTA). From the beginning to the end, the reaction rate is set as 2% of reaction progress per minute in the presented example. The reaction from the beginning to the end proceeds in 50 min at a constant rate (the dependences temperature vs time (top), reaction rate vs time (middle section) and reaction extent vs time (bottom)).
If you want more information about this Software, click here

